How to Calculate Transmission Line Impedance with Dispersion and Roughness, No Field Solver Needed!
Analytical formulas, plus Microsoft Excel, are all you need.
by Zachariah Peterson
Look at just about any expert-level signal integrity guide and you will (or rather, should) see a lot of simulation data. Most often, these results are generated with 3-D electromagnetic field solvers, even if the author is not performing simulations directly from a finished PCB layout. 3-D field solvers and 2-D field solvers are also used on the front-end to design and engineer an interconnect for a specific interface.
These applications take material inputs, intended geometry and stackup, and tell the impedance of a line. They can also return the impedance and propagation constant directly. More advanced fast field solvers, such as those from Simbeor or Polar Instruments, can provide full S-parameters for a transmission line, assuming a perfect 50Ω source and load.
Another way is possible to get to the lossy characteristic impedance and propagation constant, which can then be used to predict the S-parameters for a transmission line. This article shows how to do this without requiring a field solver, meaning the user will rely only on analytical formulas. The method shown here includes dielectric and skin effect losses, causal roughness losses, and causal dielectric constant (Dk) with dispersion, which only the most advanced PCB-specific field solvers currently include.
What is shown here was originally published by the author at IEEE EPEPS,1 and the equations can be solved in Microsoft Excel with a simple spreadsheet.
Start with the Lossless Impedance
The equations that follow describe the characteristic impedance of a transmission line as a function of frequency that includes loss terms. The result will have the following qualities:
- The resulting impedance will be a function of frequency
- The impedance will include a small reactive component due to the presence of losses
- The impedance will only be valid in the TEM limit.
The method shown calculates transmission line impedance with losses by starting from the lossless impedance, and the lossless impedance can be calculated from the line’s geometry. Essentially, provided the lossless impedance is known, loss terms can be added back in to get the lossy impedance.
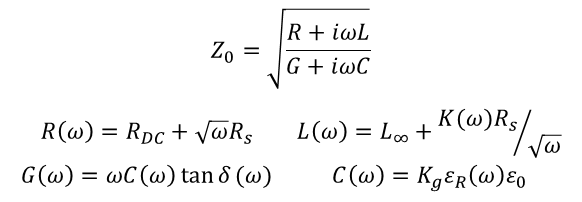
The basis for this is the RLCG model, which applies only in the TEM propagation limit. The RLCG model describes the characteristic impedance of a lossy transmission line, which includes terms for the dielectric loss contribution and the resistive loss contribution. These R, L, C, and G terms are per-unit-length circuit elements that would appear in the telegrapher’s equations. The lossy characteristic impedance and each of these terms are defined in Equation 1. (Note: Definitions here are described in Zhang.2)

Here, we have some additional terms within the RLCG terms that need to be defined. These are:
- Kg: Fringing field constant, which defines the line capacitance
- Rs: Skin resistance arising due to the skin effect
- K: Causal copper roughness correction factor as derived in Dmitriev-Zdorov.3
Next, using results from standard copper roughness models,3 we must apply a causal correction to the dielectric constant as a function of the copper surface roughness as defined by a 10-point roughness measurement. The adjusted Dk with roughness is:

Note that the dielectric constant input on the right can already be a function of frequency, and it includes the imaginary part (loss tangent) in the standard definition. This means the causally corrected dielectric constant is also a function of frequency following the same trend. This has been shown in copious experimental data from Rogers4 for a variety of interconnects.
As mentioned, the copper roughness correction factor is defined in Dmitriev-Zdorov.3 This can be calculated by hand at any frequency for a given copper roughness model. Skin effect resistance also obeys a simple formula when the conductor has a rectangular cross-section:

Equation 3 is an accurate approximation for the skin resistance for a rectangular trace above a ground plane in terms of its width and thickness.
Converting Lossless to Lossy Impedance (Z)
Note that, when there is no loss along the transmission line, the characteristic impedance and speed of a signal will be equal to:

Equation 4 shows characteristic impedance (left) and speed of a signal (right) for a single-ended line without losses. The “R” subscript in the Dk refers to the real part of the dielectric constant.
The L and C values would normally be given by a 2-D cross-section calculator (boundary element method) or from a simple online calculator.
With these two equations, we can calculate a lossy impedance, provided the lossless impedance is known (detailed below). Note that there are two equations to solve, and two unknowns (lossy impedance and lossy propagation constant). This means lossless capacitance and lossless inductance can be eliminated easily using two simple relations from the lossless characteristics:

Equation 5 shows inductance and resistance (top) and capacitance (bottom) for a lossy line.
Using these equations, we can simply take the quotient and get the square root to get the lossy characteristic impedance:

Instead of taking the quotient, we take the product and then take the square root to get the lossy propagation constant:

These equations look quite messy, so how exactly is all this used and what does it all mean?
The interpretation here is actually very simple: Provided the lossless characteristic impedance and material parameters are known, the lossy characteristic impedance can always be calculated. Just plug these known values into Equations 5 and 6, and all other signal integrity metrics can be predicted by hand.
How to Calculate the Lossless Impedance (Z0)
Those familiar with IPC-2141 or the groups of equations in Brian C. Wadell’s Transmission Line Design Handbook will know that the lossless characteristic impedance is a function of the trace geometry and dielectric constant. This also means that the lossless dispersionless impedance result from a 2-D calculator can be converted to a lossy impedance.
Z0 could be calculated using one of the following methods with the desired trace geometry:
- The microstrip or stripline formulas in IPC-2141
- An empirical model for lossless impedance
- The formulas in Brian C. Wadell’s textbook
- Any other analytical relationship that defines lossless characteristic impedance.
Any of these groups of equations shows the lossless impedance as a function of the trace geometry and dielectric constant. Those who have dielectric constant data from a PCB material datasheet can calculate the lossless impedance as a function of frequency. This can be gone with a bulk Dk value graph from the laminate vendor, or the vendor’s tabulated Dk data, which can be input into the lossless impedance equation.
The lossless impedance at each value of frequency is now known. Now simply plug in the lossless impedance into the lossy impedance equation with the other material and geometry parameters, and the result is the lossy impedance at each frequency value. This tells the lossy impedance in any frequency range where the input data are valid.
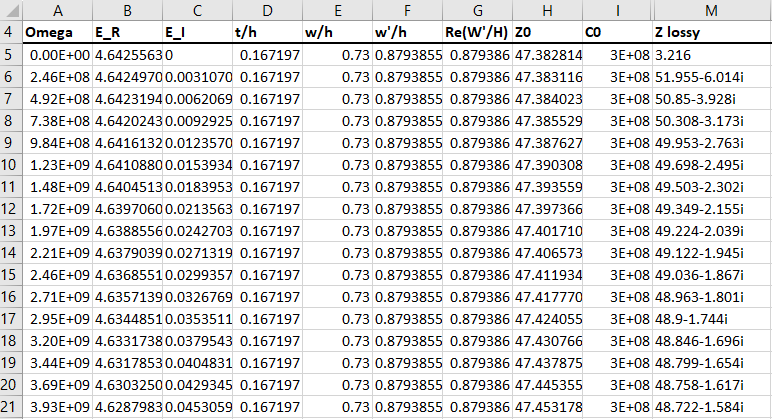
Obviously, there are a lot of data to keep track of. The easiest way to do this over a range of frequencies is to use an Excel spreadsheet. Because you are dealing with analytical formulas as outlined above, it is very easy to program these formulas into an Excel table (Figure 1) and get an impedance curve as a function of frequency.

The numbers in column H show the lossless characteristic impedance, and the values in column M show the lossy characteristic impedance, both evaluated at each angular frequency value in column A. Note that the impedance values and column M are complex numbers, meaning they include a resistive and reactive impedance. As mentioned above, the transmission line impedance will be a complex number due to the various loss factors. This is one reason why copper roughness is such a powerful bandwidth limiting factor and it will become more difficult to ensure wideband impedance matching above 56GHz Nyquist in the future.
What’s Next?
Remember that all the signal integrity metrics we care about in high-speed PCB design and RF design start from the impedance and propagation constant. In summary, we now have a process for calculating the lossy impedance of a transmission line, including dispersion, from the lossless impedance, and without the use of an electromagnetic field solver. A procedure for using this is as follows:
- Select a material thickness, dielectric constant with loss tangent, and line geometry.
- Calculate the lossless impedance using the uncorrected real part of dielectric constant from the datasheet and desired geometry (e.g., using IPC-2141, Wadell, etc.).
- Use the corrected Dk (Eq. 2), lossless impedance from Step 1, calculated skin resistance (Eq. 3), and copper correction factor3 to get the lossy impedance (Eq. 6).
- Calculate the transmission lines propagation constant (Eq. 7).
- Iterate through a range of width values until reaching a line that hits the desired signal integrity specification.
To quickly implement Step 2, use the impedance calculation models in high-end CAD tools. The right tools can provide the lossless impedance for the input width, and you can follow the rest of the process to get the lossy impedance.
With this process for calculating lossy impedance directly from geometry, an optimization algorithm that implements Step 5 may be used. A simple evolutionary or nonlinear algorithm can converge to a target signal integrity metric simply adjusting the dimensions of the line.
This problem can also be solved with the built-in evolutionary optimization tool in Microsoft Excel. A simple random search algorithm can find the width that produces a lossless impedance very close to the target across a very broad frequency range. An example algorithm in C code can be found in my EPEPS paper,1 or in the differential evolution paper from Storn and Price.5 
References
1. Z. Peterson, “Causal Transmission Line Geometry Optimization for Impedance Control in PCBs,” Proceedings of the IEEE Conference on Electrical Performance of Electronic Packaging Systems (EPEPS), October 2020.
2. J. Zhang, et al. “Causal RLGC(f) Models for Transmission Lines from Measured S-Parameters,” IEEE Transactions on Electromagnetic Compatibility, February 2010.
3. V. Dmitriev-Zdorov, “A Causal Conductor Roughness Model and its Effect on Transmission Line Characteristics,” Signal Integrity Journal, November 2018.
4. J. Coonrod, “Advancements in Prepreg Enabling New Applications for Millimeter-Wave (mmWave) and High Speed Digital (HSD),” PCB West, October 2021.
5. R. Storn and K. Price, “Differential Evolution – A Simple and Efficient Heuristic for Global Optimization over Continuous Spaces,” Journal of Global Optimization, vol. 11, December 1997.
Zachariah Peterson has an extensive technical background in academia and industry. He runs Northwest Engineering Solutions (nwengineeringllc.com), a PCB design and technical marketing firm that serves industrial automation, defense and EDA software clients; zmp@nwengineeringllc.com.

